

Google has categorized Core Web Vitals, which is a collection of various metrics that indicate the user-friendliness of a website. In simple terms, the Core Web Vitals tend to rate the website performance based on its interactivity, visual stability, and load time.
If you are a business owner having an online presence in the form of a website, you ought to know what Core Web Vitals are. Understanding their importance and the need for optimizing your website with respect to those metrics is the key to thriving in the online space.
So, this article will give you a clear insight into what Google Core Web Vitals are and how you can improve the website performance by analyzing them. Read along till the end to find out!
Watch: What are Core Web Vitals?
What are Core Web Vitals?
Websites consist of various online pages that don’t load as a whole, but in pieces. It means every web page will load photos, headlines, forms, and other elements at different times. Thus, the responsiveness of each element will contribute to recording your website’s overall loading time.
Understanding the performance of your website is crucial for catering your products or services to impatient users. A faster loading website with user-friendliness in terms of navigation and visual stability can help you stand out in the crowd of competitors.
However, to achieve that, you must rely on accurate real-time metrics, and Google’s Core Web Vitals help you with the needful!
The Core Web Vitals are a subset of various factors that contribute to Google’s ranking signals associated with page experience. In simple words, it is Google’s approach to sizing up your website’s overall UX.
Google’s Core Web Vitals are assessed for both mobile as well as desktop versions of your website. Once you know the Core Web Vitals metrics that define the performance of your website, you must prioritize implementing them in design efforts, optimizing your site for both mobile and desktop.
When you work on these vitals, there is a high chance you can rank your website higher in the Google SERPs (Search Engine Result Pages). There are three metrics under Google Core Web Vitals for assessing the performance of your website, which include:
FCP (First Contentful Paint):
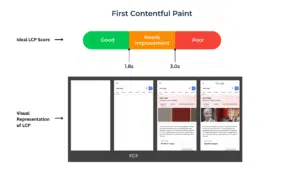
When talking about the Google Core Web Vitals, FCP is one of the key metrics that records the time taken by any content of a webpage to render on the screen. FCP metric is recorded at the moment when a page starts to load and the user gets to see the visual elements of your webpage, such as images, texts, or the background. The ideal FCP count for ensuring a webpage loads faster and delivers a good user experience is <1.8 seconds.
LCP (Largest Contentful Paint)
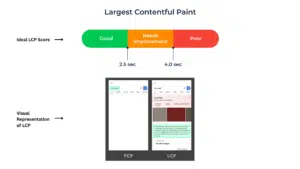
If you have newly created a website with minimum technical knowledge, you must know what LCP is in Core Web Vitals. It is one of the metrics responsible for determining how long it takes for the largest content elements on your page to load completely. A website is proven to have a good user experience if the LCP successfully loads within 2.5 seconds, upon being clicked.
CLS (Cumulative Layout Shift)

It is an important Core Web Vitals test metric that tracks the frequency of unexpected page layout fluctuations or movements while the page loads. For instance, the shifting of buttons or images on the screen. For a website to have an optimal user experience, the CLS score should not be more than 0.1.
INP (Interaction to Next Paint)
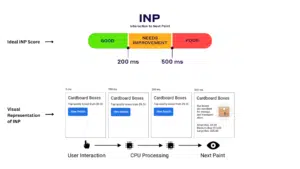
This metric measures the time taken for a web page to load the next visual update, once a user initiates any interaction. In short, INP measures the responsiveness of a website. To ensure the website provides a good user experience, the INP should be less than 200 milliseconds.
TTFB (Time to First Byte)
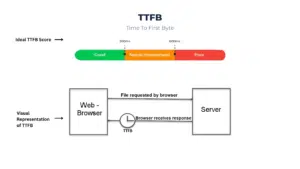
TTFB is the Google Core Web Vitals metric that measures the overall time between the request raised for a web resource and when the first byte of the response arrives. In simpler terms, TTFB is the time taken for a webpage to start loading once the request is raised by the user. The TTFB value is considered good if it is less than 0.8 seconds.
TBT (Total Blocking Time)
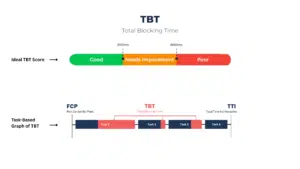
TBT is one of the many Core Web Vitals metrics, which is used for measuring the total time for which the page stays blocked before responding to the user’s input. The user’s inputs are referred to as screen taps, keyboard presses, mouse clicks and more. When the TBT score is low, it indicates that a website is user-friendly and responsive. If the TBT is less than 200 milliseconds, it is considered good.
Speed Index
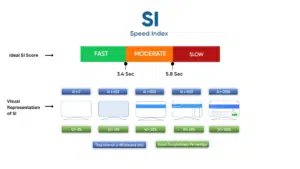
The Speed Index metric is a measurement of how quickly the content of your webpage is visually displayed while being loaded. The lower the speed index numbers, the better the performance of your website. For mobile, the speed index of less than 3.4 seconds is considered efficient, whereas for desktop, the speed index should be less than 1.3 seconds.
If you manage to improve Core Web Vitals with strategic optimizations, you can attain a website user experience that’s fast, stable, and smooth. Not just that, but it will also improve your overall SEO efforts.
There is a high chance people will stay on your website if it responds to their clicks or requests faster and offers user-friendliness in terms of navigation. Therefore, faster-loading websites often have lower bounce rates, which is a proven fact!
To help you prioritize Core Web Vitals even more, you should know that Google does consider these metrics as its ranking signals. Eventually, Core Web Vitals optimization will not just boost your website’s performance in search engine rankings but will also drive more traffic to it.
What is the Difference Between FID (First Input Delay) and INP (Interaction to Next Paint)
Since March 2024, Google has replaced one of its metrics in Core Web Vitals, FID (First Input Delay), with INP. Now, what is FID in Core Web Vitals?
Well, FID is the metric that is used to measure the interaction and responsiveness of a website. An ideal FID score was supposed to be less than 100ms, which stated that your website was a high-performing platform. FID is only used to take into account the initial responsiveness of any webpage.
On the other hand, INP takes the mantle of measuring the time taken and responsiveness of the browser to almost all user interactions, throughout the lifespan of a webpage. It means, from an initial load to the added interactions, INP reviews the comprehensive website performance, including presentation delay, processing, input delay, and others.
How to Check the Website’s Core Web Vitals Performance?
Before you make efforts to improve the Core Web Vitals for your website, you must first check the existence performance of the associated metrics. For that, you can use four different tools, which include:
1. PageSpeed Insights by Google

PSI or PageSpeed Insights by Google is an absolutely free tool that you can use for evaluating the overall performance of any single webpage, for both desktop and mobile devices. This tool also provides you with comprehensive ideas on how to make your page more responsive and user-friendly.
In order to measure the Core Web Vitals performance, here are the steps you must follow:
- Open ‘PageSpeed Insights’.
- Enter the webpage URL that you want to check the performance of.
- Click on ‘Analyze’
You will be provided with a report once it’s ready. In it, you will see a thorough breakdown of your webpage performance across varying metrics. You will see a ‘Performance Score’ that will range from 0 to 100, based on specific metrics such as:
- Speed Index
- First Contentful Paint
- LCP
- Total Blocking Time for determining INP
- CLS
Once you have the scores, you can then scroll down to the ‘Diagnostics’ tab to explore the list of things that you can implement to improve the webpage’s performance. The PSI tool will also give you a detailed insight into the accessibility, SEO proficiency, and other such factors.
2. Semrush Audit

Semrush comes with a Site Audit tool that you can use for conducting a complete technical check-up of the website. Following that, you can highlight issues that could impact the overall health.
The steps you must follow are:
- Open the Site Audit tool on Semrush.
- Enter your site domain in the given search bar.
- Click on ‘Start Audit’.
Now, you will be prompted to customize the audit settings based on your preferences. For instance, you can choose, ‘Crawler Settings’ section to choose if the tool should run its analysis on the desktop or mobile version of your website.
Once you are done customizing your settings, click ‘Start Site Audit’.
When the audit is ready on the tool’s end, you will have an ‘Overview’ report to review, with a dedication section that will go by the name ‘Thematic Reports’.
You can then find a tab, ‘Core Web Vitals’, along with a combined percentage highlighting the efficiency of your website with respect to the associated metrics. Click on ‘View Details’ to get a comprehensive review of the metrics and see the areas that have improved or need optimization.
Now,
- You will see the status of all your webpages, along with the data stating the historical performance of your website.
- Scroll down to the ‘Metrics’ tab for evaluating CLS and LCP scores, along with suggested recommendations to improve the performance.
- Check the specific metric, ‘TBT (Total Blocking Time), which you can use for assessing the INP.
- Click on any particular issue under the ‘Top Improvements’ column for learning how to resolve it.
- Under the ‘Affected Pages’ column, you will find the number of webpages affected due to the corresponding issues highlighted under ‘Top Improvements’. Click on any of the numbers to get a complete list of pages that need your attention.
3. Chrome UX Report

The Chrome UX Report, or CrUX, is one of the public datasets, capable of giving you insights into how real browser users interact with websites. In order to access CrUX, you can use the dedicated dashboard available with Looker Studio.
The steps you must follow to access your CrUX Report are:
- Gain access to the ‘Looker Studio’ tool.
- Go to the CrUX Dashboard option within it.
- Enter the site URL that you want to analyze for Core Web Vitals.
- Click on ‘Go’.
You will now be seeking the Core Web Vitals performance with respect to your website. However, you can also evaluate other data points depending on your preferences. When on the overview dashboard, you will find a holistic summary of all the webpages and their performance quotient for every metric of Core Web Vitals.
The result is specified uniquely with respect to both desktop and mobile users. Take a note of these metrics and determine what areas need improvement. For an in-depth analysis, you can choose individual reports for any specific metric that you want to review.
For instance, you can pull a report on the website’s LCP on a monthly basis to see how the performance has improved or declined over time. The default overview setting will be to give you a combined performance insight across all devices. You can toggle this setting to see mobile-only or desktop-only metrics by clicking on the ‘Device’ option in the top-right corner of the page.
4. Google Search Console

You can also use Google Search Console to retrieve the Core Web Vitals report for your website. This web tool uses real-world data to give you an accurate replication of how the end-users experience your website.
Google Search Console groups together several pages of your website that share similar issues. Thus, it will be easier for you to identify the root cause of common problems on your website and address them.
For being able to use this report, you must:
- Sign in to Google Search Console.
- Select ‘Core Web Vitals’ from the menu.
Here, you will get a high-end overview of the page URLS that Google considers ‘Poor’, ‘Good’, or ‘Needs Improvement’. This report comprises performance stats for both the desktop and mobile versions of your website.
If you want a more detailed understanding of the performance of your website, you can just click on ‘Open Report’ from any of the charts displayed. Once you access the report, you will notice a bar graph showing the webpages that don’t align with the specified Core Web Vitals thresholds.
In order to see what Core Web Vitals issues exist in your website and the webpages affected due to them, scroll down to the ‘Why URLS aren’t Considered Good?’ panel. Click on the respective issues to know more about them.
One thing you must keep in mind is that the Core Web Vitals report by Google Search Console isn’t designed to specify the status of any specific webpage. Instead, it enables you to gauge the overall health of your website in a comprehensive manner.
How to Improve Core Web Vitals Performance for Your Website?
Now that you are aware of the painful areas in your website, it is time to know how to fix the Core Web Vitals issues through impactful measures:
Scaling the LCP Score
You can propose large or small changes to boost the LCP score of your website. It is one of the most crucial Core Web Vitals metric to ensure the largest content on your webpages load smoothly and responsively.
Some of the things you can do to attain a good LCP score are:
- Optimize your images by using web-friendly formats such as WebP and compressing them. You can also use a WEBP Converter to simplify the conversion process. Using WebP as your image format, the media content on your website will be 34% smaller than the usual format.
- Enable page caching, which will allow the webpage to be stored on the server, once it’s finished loading after initial interaction. This way, the same page can be retrieved faster, next time the same user opens it.
- Upgrade your web hosting from a shared plan to dedicated or cloud hosting. Shared hosting often slows down the website as many accounts share the same resources, such as processing power and memory. Therefore, upgrading to cloud or dedicated hosting will get you a separate server for your website, making the content on it load faster. For WordPress sites, moving to a managed WordPress hosting environment like WP Engine can also help improve LCP and TTFB by combining optimized server resources, built-in caching, and CDN support — often handled as part of a streamlined site migration.
Work on Improving the CLS Metric
Your CLS score drops especially when elements like ads, banners, or images push the relevant or main content to the side or down while they load. Here are the things you can adapt to improve the overall CLS score:
- Add height and width size attributes to the videos and images you add to your webpages. This way, the browser will be reserving space for media content like videos or images when the page loads. This way, everything will fit the screen in a neat manner and won’t be moving around the content as people view the site.
- You can also use aspect ratio boxes within the CSS code. It is one of the most responsive web design preferences that works by creating a separate container for your content, while keeping a similar width-to-height ratio across all screens.
- Optimize the type of font you are using across the webpage, which can also be responsible for impacting your CLS score. Avoid using web fonts that need downloading before any browser can load them. It is better to stick with the existing system fonts that are pre-downloaded in most devices, such as Verdana, Helvetica, or Arial.
Consider INP as the Most Crucial Metric Above All
Your INP score can drop if the website has several large scripts present within it or has extensive JavaScript code running in the backend. Developers make use of JavaScript for coding some dynamic site features such as forms, animations, menus, and others.
However, if the code is too complex, it will slow down the website’s response to certain user actions. Some of the things that you can do to improve the INP score for your website are:
- You can instruct your developer to improve the INP quotient of your website by minimizing the JavaScript as well as other unnecessary code.
- Consider breaking up long tasks that the browser runs in the backend and might hamper the users’ interaction with the website. By breaking the extensive tasks into short and concise segments, you are enabling browsers to promptly and responsively handle the users’ interactions.
TBT or Total Blocking Time is referred to as a proxy metric for the INP. So, optimizing the INP metric will eventually help you reduce the blocking time of your webpage.
Boost the FCP Score
You can improve the FCP score by ensuring your content is served faster. At the same time, you must optimize and reduce the resources that are required for your pages to load. Some of the ways you can boost the FCP score and enhance the overall performance of your website are:
- Make sure to enable website caching and eliminate the render-blocking resources. At the same time, you can prefer using a faster server.
- Preload the critical resources required for loading the webpages, and also reduce the overall DOM size.
- Avoid lazy-loading the images above the page fold, and prefer serving the images in next-gen formats.
Reduce the TTFB Numbers
In order to improve the overall performance of your website, based on the Core Web Vitals, you ought to reduce the TTFB numbers. For that, you must optimize the server response times by using efficient caching and scripting measures.
Beyond that, you can use CDNs (Content Delivery Networks), add browser caching, minimize page redirects, and compress certain assets. TTFB is often poor because of poor server responses, connection issues, and high network latency. You must aim at fixing those core problems to get a better TTFB score.
Prioritize Core Web Vitals Optimization from the Design Phase of Your Website Project
The right practice is to avoid the ongoing to-and-fro optimizations for improving the website performance, loading speed, responsiveness, and user-friendliness. To achieve that, it is advisable to prioritize Google’s Core Web Vitals, right from the design phase of your development project.
It will help you guarantee optimal website performance, right from day one! Moreover, you can also direct your efforts towards utilizing SEO practices and ranking your website higher in the Google SERPs, without being held back due to poor performance metrics.
Conclusion
You must know that Core Web Vitals can be considered immensely important to determine the user experience quotient of your website. When you manage to attain good scores across all metrics of Google’s Core Web Vitals, your website can contribute towards better engagement, higher conversions, and lower bounce rates.
Not just that, but your SEO efforts will also turn fruitful as Google Core Web Vitals does help with better search rankings. There are various tools out there to help you determine the accurate performance metrics associated with Core Web Vitals. Utilize the reports and adopt the necessary measures to attain better performance of your brand website.
To know more, feel free to reach out to Simpalm, a leading web design company in USA. We specialize in creating high-performance websites that meet Core Web Vitals threshold limits and go beyond by optimizing your site to get your digital presence back on track.